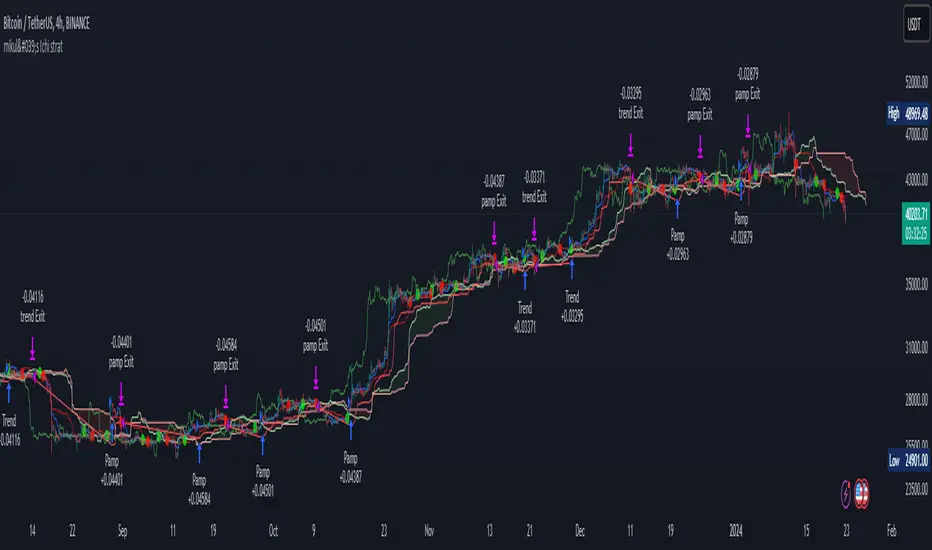
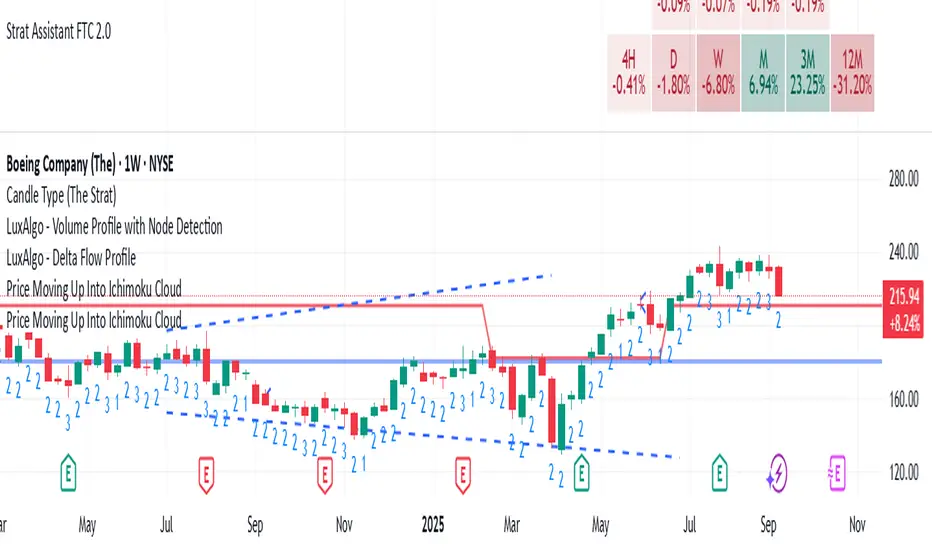
mikul's Ichimoku Cloud Strategy v 2.0This is an Ichimoku cloud (long) strategy with both pump signals and trend signals.
It has both ATR stop loss, trailing percentage stop loss and also ichomoku cloud exit signal.
You can also combine the ATR stop loss and the trailing percentage stop loss with the Ichimoku cloud exit signal and a the take profit percentage.
In this example I use the default ATR stop loss method for taking profit.
10000$ is my initial capital and I risking 10% every trade. Commission is set to 0.075%.
Everything is set to default in this example.
There is also a moving average filter that is available, set to 200 EMA and turned off by default.
Conditions for taking a long position:
Trend Signal:
• Positive cross above the cloud
• Chikou span(lagging span) above price action
• Price above the Cloud
Pump Signal:
• Cloud ahead of you is green
• Price above the cloud
• Positive cross (Doesn’t Matter Where)
• Chikou span(lagging span) above the cloud
Ichimoku cloud exit signals:
• Negative cross
• Chikou span(lagging span) touches the price action
This strategy is totally free as freedom and as in free beer!
I do this for myself, but I like sharing and I want everyone to have the ability to use what I make no matter your economic situation.
If you have any suggestions for this strategy or perhaps any filtering options that could be fun to experiment with, then please leave a comment with your suggestion and maybe I can add it to the next version.
在腳本中搜尋"Ichimoku Cloud"
[OZ]MTF Ichimoku CloudBased on this script from RicardoSantos:
This script can display Ichimoku cloud , SSA , SSB , Chikou, Kijun and Tenkan from another time frame.
With it you can apply Karen Péloille's MTF Ichimoku Kinko Hyo advanced trading techniques on TradingView.
By default Tenkan is not displayed (fully transparent).
The original script has been enhanced to draw the full cloud beyond the price and to draw the Chikou.

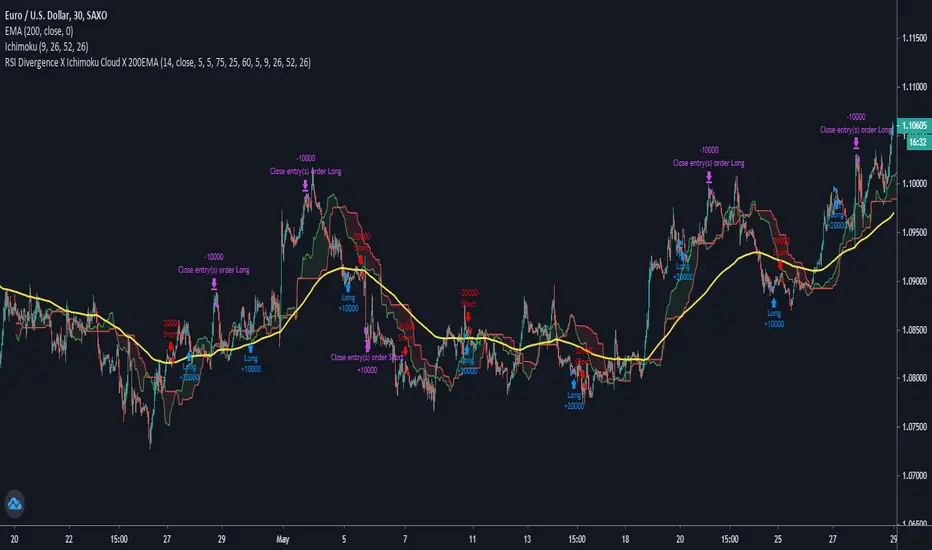
RSI Divergence X Ichimoku Cloud X 200EMAHi all,
This script is a combination of the RSI Divergence Strategy combined with Ichimoku Cloud and 200 EMA .
A long position is entered only when the RSI identifies a bullish divergence (either regular or hidden), and that the Ichimoku Cloud is above the 200 EMA . This is to ensure that there is a confirmation of a bullish trend before an entry.
Similarly, a short position is entered only when the RSI identified a bearish divergence (either regular or hidden), and that the Ichimoku Cloud is below the 200 EMA . This is to ensure that there is a confirmation of a bearish trend before an entry.
I find that this script works best on Intraday charts.
This is just a simple script I built on my third attempt of backtesting strategies on TradingView. Do give it a go and let me know if you guys have any feedback or comments about it. Happy trading!
Covengers Ichimoku Cloud Easy 0.1
This is Covengers Ichimoku Cloud's EASY VERSION.
This is for you who don't know about Ichimoku,
to describe "Time tiktok & Price tiktok Trading".
☆Time tiktok & Price tiktok Trading☆
IF 1. DON'T CARE ABOUT LOWEST PRICE.
IF 2. DON'T CARD ABOUT HIGHER PRICE.
BUY IF 1. IS "CLOSE" BROKE THROUGH BASE LINE?
BUY IF 2. IS "CLOSE " SUPPORTED BY BASE LINE?
-> THEN BUY !
At this time, Base line should be STOP LOSS line.
SELL IF 1. IS "CLOSE" BROKE THROUGH BASE LINE?
SELL IF 2. IS "CLOSE" RESISTED BY BASE LINE?
SELL IF 3. IS "CLOSE" BROKE THROUGH ICHIMOKU CLOUD?
-> THEN SELL !
Buy conservatively, Sell aggressively.
"less LOSS" better than "much PROFIT"
-
Covengers Ichimoku Cloud의 EASY 버전입니다.
차트를 하나도 모르는 당신에게
임운자재를 설명하기 위해 만들었습니다.
☆임운자재 매매법☆
절대 조건 1. 바닥에는 관심을 두지 않는다.
절대 조건 2. 천장에는 관심을 두지 않는다.
매수 조건 1. 종가가 기준선을 돌파하였는가?
매수 조건 2. 종가가 기준선의 지지를 받는가?
-> 매수
이 때, 손절라인은 기준선이 된다.
매도 조건 1. 종가가 기준선을 돌파하였는가?
-> 매도
매도 조건 2. 종가가 기준선의 저항을 받는가?
-> 매도
매도 조건 3. 종가가 구름대를 돌파하였는가?
-> 매도
매수는 보수적으로, 매도는 공격적으로.
많이 따는 것보다, 잃지 않는 것이 중요하다.
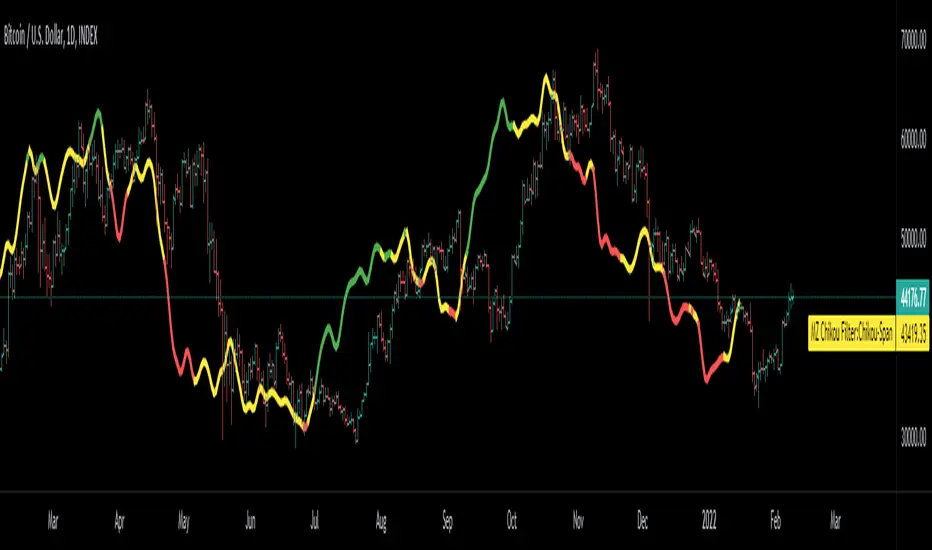
Chikou Filter for Ichimoku CloudThis Indicator enhances functionality of Chikou-Span from Ichimoku Cloud using a simple trend filter.
Methodology
Chikou is basically close value of ticker offset to close and it is a good for indicating if close value has crossed potential Support/Resistance zone from past. Chikou is usually used with 26 period.
Chikou filter uses a lookback length calculated from provided lookback percentage and checks if trend was bullish or bearish within that lookback period.
Bullish : Trend is bullish if Chikou span is above high values of all candles within defined lookback period. Green color shows bullish trend.
Bearish: Trend is bearish if Chikou span is below low values of all candles within defined lookback period. This is indicated by red color.
Reversal / Choppiness : White color indicates that Chikou are swinging around candles within defined lookback period which is an indication of consolidation or trend reversal.
Default Settings
Different source types are included but I've found that (OHLC4+High+Low)/3 is better for Chikou and Symmetrically Weighted Moving Average (SWMA) is also applied but it produce some repainting though. Default period is set to 26 and lookback percentage is 50%. Low percentage would decrease filter's efficiency.
Usage
This filter can be used to check if Chikou crossover has occurred in past. This can be used with Donchain channels, Bollinger Bands or any Moving Average as replacement of High / Low values. I'll use this indicator in all my Ichimoku Cloud studies especially adaptive ones. Filter outputs in Color and Integer format; both can be used as signals definitions.
^-^ Three Ichimoku Clouds ^-^ 4x4 Moving Average x EMA ^-^Three ichimoku clouds
Four moving averages
Four exponential moving averages

MTF Ichimoku CloudHere is my take on Ichimoku Cloud, Multiple Time Frames, based on the
most excellent work of "PineCoders" (MTF Selection Framework functions)!
The big advantage is that on 1 image you can easily see where
price is compared to Ichimoku Cloud patterns (each of different Time Frames).
This gives a lot of Support and Resistance area's!
I restricted the amount of MTF's at 2, more is just too messy
To make it more clear:
- Conversion line and Baseline in present timeframe : thick line
- Conversion line and Baseline in Higher Time Frame (HTF 1) : thin line
- Conversion line and Baseline in Higher Time Frame (HTF 2) : line with circles
All lines has labels at the right of the line with corresponding Time Frame
Since some prefer different settings with higher Time Frames,
each period in each Time Frame can be changed
The Time Frames itself can be chosen:
- or a multiple of present Time Frame
- or a fixed chosen Time Frame
Thanks!
Combination Ichimoku CloudThis indicator allows you to display two Ichimoku Cloud settings simultaneously. Each variable can be set independently, including its visibility.
Basically a way to combine two "Ichimoku Cloud" indicators into one slot.

Ultimate Ichimoku Cloud StrategyThe goal of this strategy script is to provide the ultimate experience to anyone interested in the Ichimoku Kinkō Hyō (Ichimoku Cloud). The script is designed to be highly customizable and allows the user to set a custom trade date range and select any combination of inputs and conditions that satisfy their goals. Additionally, the script allows the user to visually see any combination of their set conditions by clicking the " Show Conditions Visually " checkbox. Doing so will color the background in a different color where the conditions align. Finally, a simple Stop/Take profit is added for those that wish to exit based on percentages over Ichimoku conditions.
As always, please let me know if there are any bugs, something useful that could be added or if you need some help. Leave a like if you wish!
Dual Ichimoku CloudDual Ichimoku cloud
Now you don't need to switch between time frames to see cloud support/resistance!
Configure cloud as you wish then set ratio.
Example Rations
3 Minutes to 15 Minutes = 5
15 Minutes to 1 Hour = 4
1 Day to 1 Week = 5

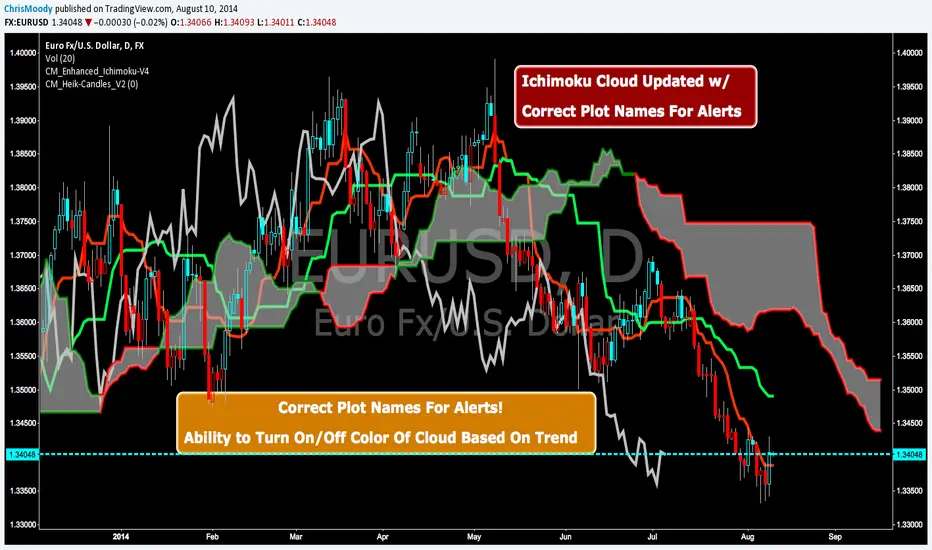
CM Enhanced Ichimoku Cloud-V4CM Enhanced Ichimoku Cloud-V4 Updated For Alerts!!!
Correct Plot Names For Alerts!
Ability to Turn On/Off Color Of Cloud Based On Trend!
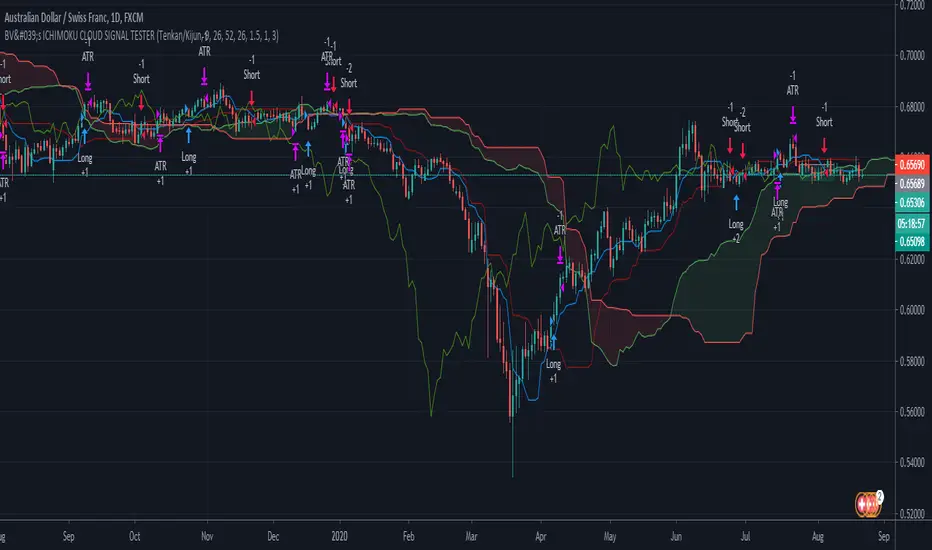
BV's ICHIMOKU CLOUD - All Signalshello traders,
With this script you will be able to test the different signals offered by the ichimoku cloud system.
Crossover Tenkan Kijun
Crossover Tenkan Kijun above Kumo
Crossover Price Kijun
Crossover Price Kijun above Kumo
Crossover Price Tenkan
Crossover Prince Tenkan aboce Kumo
Crossover price Kumo
Kumo Color Change
Remember to check the JPYPAIR checkbox if you test a JPY/xxx pair, this will adjust the stop loss and take profit calculation.
You can also adjust the TP and SL values in the parameters to change their ratio. I had good results in 1.5:1 with the :
SL = 2.25 x ATR(14)
TP = 1.5 x ATR(14)
At your tests, don't hesitate to share your results.
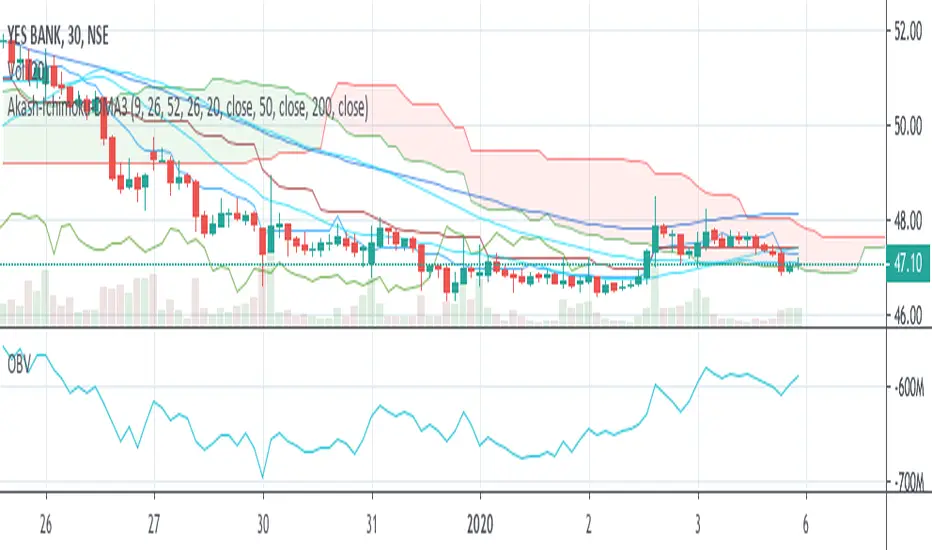
Akash-Ichimoku Cloud + Moving avg of 20-50-200Its a convenient combo indicator of ichimoku cloud and moving averages of 20-50-200
This can help save on limit of indicators in free version.
Most of the positional trading calls can be done with this combo indicator.
Akash Rajpal
4 EMAs With Colors(100,300,600,1000)+ichimoku Cloud4 EMAs With Colors(100,300,600,1000) To detect trend
+ichimoku Cloud to have successful trading
Geometric Ichimoku CloudThis version of the Ichimoku Cloud indicator uses the geometric mean rather than the arithmetic mean.

Quad Moving Avarage-Ichimoku Cloud-ALMA-Bollinger BandsAll-in-One
Ingradients:
* Ichimoku Cloud,
* 2 Simple Moving Avarage (SMA),
* 2 Exponential Moving Avarage (EMA),
* 2 Arnoud Legoux Moving Avarage (ALMA),
* Bollinger Bands and
* Volume Based Colored Bars (developed by KIVANÇ fr3762).
Compiled for limitations. Thank you.


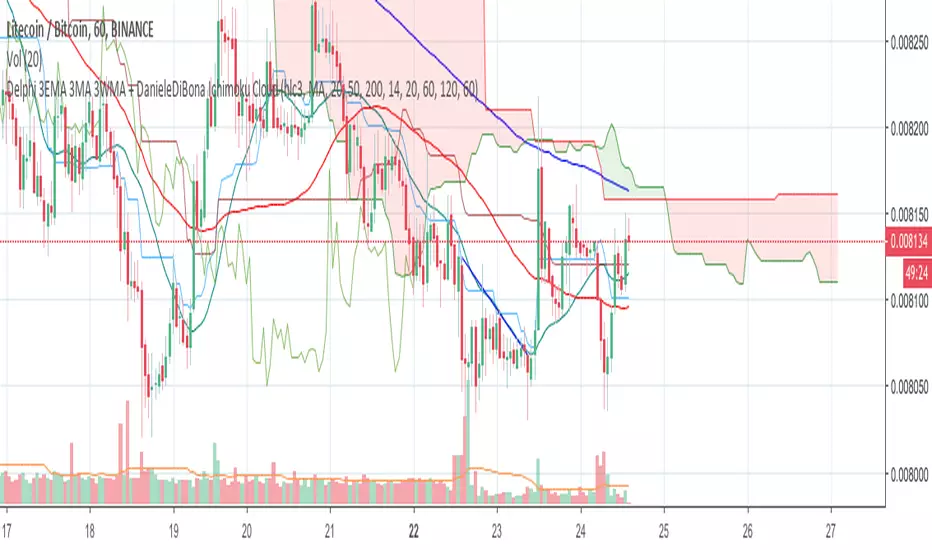
Delphi 3EMA 3MA 3WMA + DanieleDiBona Ichimoku Cloudadded Ichimoku Cloud with amazing settings included ;)))
Covengers Ichimoku Cloud ver 0.4Covegers Ichimoku Cloud ver 0.4 Released !
Middle Price Line Updated !
IF,
High Price Line head Downward = Sell
Low Price Line head Upward = Buy
EASY WORK.
//
코벤져스 일목구름 0.4 버전이 출시되었습니다.
중간값 선이 추가되었습니다.
만약,
고가의 중간선이 하향한다면 매도
저가의 중간선이 상향한다면 매수
정말 간단한 개념인데 결과가 재밌습니다.
0.41 버전이 추가업데이트 될 예정입니다.

Covengers Ichimoku Cloud ver0.3Covengers Ichimoku Cloud ver0.3
What's NEW?
ver 0.3 Plot Arrow When leadLine 1 and leadLine 2 CROSS
-END-
버전 0.3에서 변한 것
구름대 꼬임이 일어날 경우 화살표를 표시합니다.
끝


Machine Learning + IchimokuIchimoku Cloud + Machine Learning Levels is an advanced indicator that merges a classic trend tool with machine-learned supply & demand zones. Combining the two can help traders identify trends and key price zones with greater confidence when both signals align!
How it Works
The Ichimoku Cloud component identifies the trend direction and momentum at a glance – it shows support/resistance areas via its cloud (Kumo) and signals potential trend changes when the Tenkan-sen and Kijun-sen lines cross. Meanwhile, the Machine Learning module analyzes historical price data to project potential support and resistance levels (displayed as horizontal lines) that the algorithm deems significant. By combining these, the script offers a two-layer confirmation: Ichimoku outlines the broader trend and equilibrium, while the ML levels pinpoint specific price levels where the price may react. For example, if price is above the Ichimoku Cloud (uptrend) and also near an ML-predicted support, the confluence of these signals strengthens the case for a bounce.
How to Use
Apply the indicator to a chart like any other TradingView script. It works on multiple asset classes (see supported list below). Once added:
Ichimoku Lines
Tenkan-sen (Blue): Short-term average reflecting recent highs/lows.
Kijun-sen (Red): Medium-term baseline for support/resistance.
Senkou Span A (Green) & Senkou Span B (Orange) form the “Cloud” (Kumo). Price above the Cloud often signals a bullish environment; price below it can signal a bearish environment.
Chikou Span (Purple): Plots current closing price shifted back, helping gauge momentum vs. past price.
ML-Predicted Support/Resistance Lines (Green/Red Horizontal Lines)
Green Horizontal Lines – Potential support zones.
Red Horizontal Lines – Potential resistance zones.
These dynamically adjust based on the specific asset and are updated as new historical data becomes available.
Password (for Advanced Features)
In the indicator’s Settings, there is an input field labeled “Password.” The password corresponds to the ticker(s) listed below.
Stocks
TSLA, NVDA, AAPL, AMZN, PLTR, AMD, META, MSFT, MSTR, GOOG, GME, COIN, NFLX, BABA, UBER, HOOD, NKE
Cryptocurrencies
ETH, BTC, SOL, BNB, XRP, ADA, DOT, DOGE, LTC, JUP, LINK, INJ, FET, SAND, HBAR, TRX, SHIB, UNI
(If you attach the indicator to any unlisted ticker, you will only see the Ichimoku Cloud.)
Why It’s Unique
This script is a fresh take on market analysis – it’s original in fusing Ichimoku’s visual trend mapping with machine learning. The Ichimoku framework provides time-proven trend insight, and the ML levels add forward-looking context specific to each asset. By uniting them, the indicator aims to filter out false signals and highlight high-probability zones. No repainting occurs: Ichimoku values are based on closed data, and ML levels are computed from historical patterns (they do not retroactively change).
Ichimoku Cloud + Machine Learning Levels offers an informative blend of old and new analysis techniques. It clearly shows where price is relative to trend (via Ichimoku) and where it might react in the future (via ML levels). Use it to gain a richer view of the market’s behavior. I hope this indicator provides valuable insights for your trading decisions. Happy trading!